
Key Takeaways
Cost per Token is misleading. A model 10x cheaper per token can be 5x more expensive per outcome once retries, multi-turn loops, and human escalation are counted.
Cost per Success is the only metric that matters for P&L. It includes the $15 support ticket triggered when the AI fails — which dwarfs token savings.
The "expensive" model is often 83% cheaper. A premium reasoning model resolving 95% of intents in 1 turn costs $0.76 per intent, while a cheap model needing 5 turns and escalating 30% costs $4.50.
Industry standards like FOCUS v1.3 and OpenTelemetry make unit economics trackable, moving teams from "cloud spend" to "business value."
Model routing: how to cut LLM costs up to 90%
Why Does Lower Cost Per Token Often Increase Your Total AI Bill?
You've likely experienced the "Efficiency Paradox" in your recent budget reviews.
You walk in armed with infrastructure metrics. You show the dashboard: "We switched to the 'Mini' model variants. Our cost per 1,000 tokens is down 40% quarter-over-quarter."
But the CFO points to the bottom line. The total bill hasn't gone down; it might even have gone up. Worse, the VP of Customer Support is reporting a spike in ticket volume.
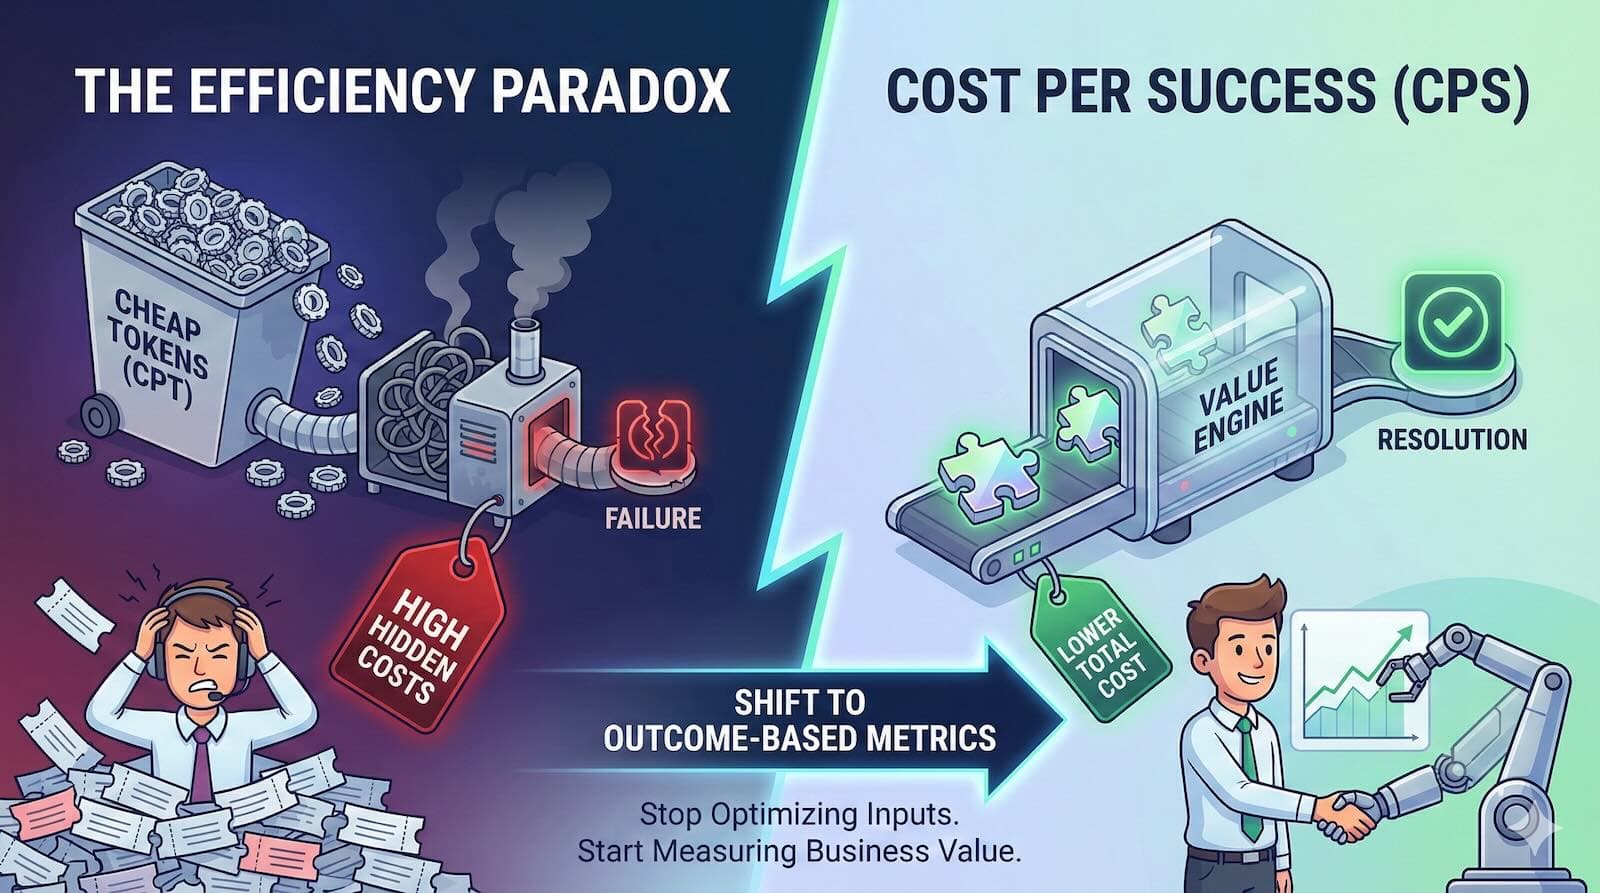
If you optimize your AI strategy based on Cost per Token, you are making individual API calls cheaper, but you might be making the business outcome far more expensive.
This is the central debate in AI FinOps for 2026: Do we measure the cost of the raw material (Tokens) or the cost of the result (Success)?
🚨 Are You Optimizing the Wrong Metric? A Self-Assessment
Before we dive into the math, let's diagnose your current situation. Check all that apply. If 3 or more are true, you lack outcome-based visibility.
[ ] Your token costs are down, but the total LLM bill is flat or up.
[ ] Customer support tickets increased after you "optimized" your prompts.
[ ] You can't explain which specific product features drive 80% of your AI spend.
[ ] You do not track a "Success Rate" metric per feature.
[ ] You have never calculated your Cost per Success.
At a Glance: The Comparison
To understand why your bill is high despite your "optimization," we need to look at what these metrics actually capture.
Feature / Factor | Cost per Token (CPT) | Cost per Success (CPS) |
Primary Focus | Infrastructure Consumption | Business Value & Outcome |
Accounting for Failure | Ignores it. Failed attempts cost the same. | Includes it. Failures increase the cost of success. |
Human Labor | Excluded | Included (Escalation costs, ~$15/ticket) |
Optimization Goal | "Make the model cheaper." | "Make the system efficient." |
Best For... | Anomaly detection, contract negotiations, benchmarking. | P&L analysis, architectural strategy, ROI proof. |
What Hidden Costs Make Cheap AI Models More Expensive?
The fatal flaw of optimizing for tokens isn't that tokens are unequal providers; bill them equally. The flaw is that this metric ignores the hidden multipliers of stochastic AI systems.
Unlike traditional software, where a function operates deterministically, LLMs operate on probabilities. When a "cheap" model fails, it triggers a chain reaction of costs.
1. The Multi-Turn Tax
A cheap model often lacks reasoning capabilities. It may require 5 turns to understand what a smart model grasps in 1. That isn't just a user experience issue; it's a financial multiplier. This same pattern appears across AI architecture — flow-based agents fail 91% of the time for the same reason: they optimize for step cost rather than outcome.
Industry data highlights the severity of this tax:
1-turn sessions: 95% success rate, average cost $0.015.
3-turn sessions: 88% success rate, average cost $0.041 (2.7x more expensive).
5+ turn sessions: 68% success rate, average cost $0.089 (6x more expensive, with a 27 point drop in success).
Source: Aggregated data from LLM observability platforms (PromptMetrics, Arize, LangSmith) and FinOps case studies, 2024–2025.
2. The Retry Tax
If the model hallucinates or outputs invalid JSON, your orchestration layer must retry. You pay for every failure.
3. The Escalation Tax
This is the budget killer. When the AI fails, the user gives up and creates a support ticket.
A Note on Variance and Confidence Intervals
Because LLMs are stochastic, your metrics will fluctuate. A prompt might succeed 95% of the time today and 92% of the time tomorrow. When tracking Cost per Success, relying solely on averages can be misleading.
Why Confidence Intervals Matter:
If your Cost per Success is $0.76 with a 95% CI of ±$0.05, you're 95% confident the actual cost is between $0.71 and $0.81. If you have only 50 samples, that range might be ±$0.20 (too noisy to make decisions).
Rule of thumb: Require n≥100 sessions per feature before calculating CPS to distinguish fundamental architectural changes from random noise.
How Much Can the Wrong Metric Cost You? Two Scenarios
Let's look at two realistic scenarios to see how "efficiency" can destroy your budget.
Scenario A: The "Efficient" Chatbot
Strategy: Optimize for Tokens. You choose a lightweight model (e.g., GPT-4o-mini).
Token Cost: Very low ($0.15 / 1M inputs).
Performance: The model struggles with context, requiring an average of 5 turns per resolution.
Outcome: It resolves 70% of requests. 30% escalate to a human.
Token Cost per Intent: $0.0019.
Hidden Labor Cost: 30% escalation rate × $15.00 (Tier 1 Support: 10 mins @ $90/hr loaded cost) = $4.50.
Real Cost per Intent: $4.50
Scenario B: The "Expensive" Agent
Strategy: Optimize for Success. You choose a premium reasoning model (e.g., GPT-4).
Token Cost: High ($10.00 / 1M inputs).
Performance: High reasoning capability allows for 1-turn resolution.
Outcome: It resolves 95% of requests. Only 5% escalate.
Token Cost per Intent: $0.014 (7.4x more expensive in tokens than Scenario A).
Hidden Labor Cost: 5% escalation rate × $15.00 = $0.75.
Real Cost per Intent: $0.76
Summary: Scenario A vs. Scenario B
Metric | Scenario A (Mini Model) | Scenario B (Reasoning Model) |
Token Cost | $0.0019 | $0.014 (7.4x higher) |
Turns | 5 | 1 |
Success Rate | 70% | 95% |
Escalation Rate | 30% | 5% |
Total Cost/Intent | $4.50 | $0.76 |
Winner | ❌ | ✅ 83% Cheaper |
🚨 Critical Clarification: Intent vs. Success
The figures above represent Cost per Intent (the average spend every time a user interacts, regardless of the outcome). To calculate the Cost per Success (the marginal cost actually to solve the problem), we divide by the success rate:
Scenario A: $4.50 / 0.70 = $6.43 per success
Scenario B: $0.76 / 0.95 = $0.80 per success
The Verdict
The "Expensive" model is 83% cheaper for the business ($0.76 pintentent vs. $4.50).
The Insight: If you only looked at your cloud invoice, Scenario A looks like a win. If you look at the P&L, Scenario A is a disaster. The labor cost of escalation dwarfs the savings on compute.
Real-World Case Study: Enterprise Invoice Extraction
This isn't just hypothetical. Here is how this dynamic played out for a finance team processing 2 million invoice pages per year.
The Challenge: The team initially optimized for token cost, utilizing GPT-4o-mini with a minimized context window (500 tokens).
Initial Token Cost: $0.08 per page.
The Problem: The model struggled with complex layouts, resulting in a 35% retry rate and a 10% human-review rate.
Total cost: $0.31 per page (driven by manual review).
The Pivot: They switched to GPT-4-turbo and increased the context window to 2,000 tokens to include more layout data.
New LLM Token Cost: $0.035 per page (higher due to 2,000-token context vs. 500).
The Result: The retry rate dropped to 10%, and the human review dropped to just 2%.
The New Financial Breakdown:
Inference + Infra: $0.036
Retries (10% rate): $0.004
Human Review (2% rate): $0.04
Orchestration: $0.001
New Total Cost: $0.081 per page
Outcome: They achieved 74% savings despite token costs being comparable to or higher in certain extraction steps. (Source: Petronella Tech Unit Economics Analysis)
Does This Apply to Self-Hosted Models?
A common objection is: "We run Llama 3 on our own GPUs, so token costs don't apply to us."
Yes, they do arguably more so.
Your "Cost per Token" is your GPU lease cost divided by usage. But if your self-hosted Llama 8B model fails to resolve the user's problem, you are burning $2/hr GPU time for zero value, plus incurring the exact $15 escalation cost.
The Break-Even Math
API Costs: Scale linearly with volume (e.g., $10 per 1M tokens).
Self-Hosted Costs: Fixed GPU lease ($2/hr × 730 hrs = $1,460/month per A100) + electricity/ops.
Break-even calculation:
At 100k requests/month: API costs ≈ $1,000. Self-hosting is more expensive.
At 1M requests/month (~1B tokens at 1k avg/request): API costs ≈ $10,000. Self-hosting wins on raw compute cost.
At 10M requests/month, self-hosting is roughly 10x cheaper in compute costs.
However, this assumes:
High GPU utilization (>70%; idle GPUs still cost $1,460/month).
Negligible MLOps overhead (model serving, monitoring, retraining).
Equal success rates. If your self-hosted model has a lower success rate than the API model (Scenario A vs B), the labor costs will likely wipe out your GPU savings.
When Cost per Token is Sufficient
We aren't suggesting you throw CPT away entirely. It remains a vital metric for specific infrastructure tasks:
Infrastructure Monitoring: Detecting runaway loops or DDoS-style token consumption.
Contract Negotiations: Calculating volume to commit to Provisioned Throughput Units (PTUs) or reserved capacity discounts.
Model Benchmarking: Comparing raw efficiency between model architectures (e.g., Llama 3 vs. Mixtral) in controlled experiments.
However, for strategic business decisions, it should never be the primary KPI.

Strategic Framework: How to Measure This
You cannot manage what you cannot measure. Most teams struggle with Cost per Success because their billing data sits in one silo (Finance) and their event logs sit in another (Engineering).
1. The Standard: FOCUS v1.3
The FinOps Foundation's FOCUS v1.3 specification provides a standardized schema for normalizing billing data across providers. FOCUS enables organizations to extend cost data with AI-specific dimensions like ModelVersion, PromptVersion, and FeatureTag. Adopting this standard is the first step toward making Cost per Success feasible at scale.
2. Instrumentation: The "How-To."
CTOs often ask, "How do I actually track this?" It requires a three-step instrumentation pipeline:
Event Telemetry: Use OpenTelemetry (OTel) to capture metadata for LLM calls. You must tag every call with
request_id,session_id,model, andfeature_tag.Outcome Labeling: The critical missing link. You must tag each session with
success=True/False.Implicit Signals: User did not click "Contact Support."
Explicit Signals: User clicked "Thumbs Up" or code execution returned exit code 0.
Cost Join: Link your billing data (in FOCUS format) to your telemetry via
request_id, then aggregate by feature and outcome.
Tools such as PromptMetrics, LangSmith, and Portkey have built-in cost-tracking features that bridge this gap. Alternatively, you can build a custom pipeline feeding OTel data into your analytics database (Snowflake/BigQuery).
If you're also looking to reduce your overall AI tooling spend, see our guide on how to cut your AI coding bill. For a deeper look at why LLM deployments fail to control costs, read why "ship fast, fix later" breaks AI startups.
Frequently Asked Questions
What's the difference between Cost per Intent and Cost per Success?
Cost potential is your average spend every time a user interacts, regardless of outcome. Cost per success divides that by your success rate — so if you spend $4.50 pintentent but only resolve 70% of requests, your CPS is $6.43. CPS shows what you actually pay per solved problem, which is what the business cares about.
How do I calculate my escalation cost?
Multiply your escalation rate by the fully-loaded cost of a human support interaction. For Tier 1 support, $15 per ticket is a common benchmark (10 minutes at ~$90/hr loaded cost). If 30% of AI interactions escalate, that's $4.50 pintentent in hidden labor — often dwarfing your token costs by orders of magnitude.
Does Cost per Success apply to self-hosted models?
Yes, arguably more so. Your "token cost" becomes GPU lease cost divided by usage. If your self-hosted Llama model fails to resolve problems, you're burning $2/hr GPU time for zero value, plus the same $15 escalation cost. Fixed infrastructure costs make low success rates even more punishing because you can't scale GPU spend down when the model underperforms.
What tools do I need to track Cost per Success?
You need three things: event telemetry (OpenTelemetry tagging every LLM call with request_id, session_id, model, feature_tag), outcome labeling (tagging each session success=True/False), and a cost join linking FOCUS-formatted billing data to telemetry. Tools like LangSmith, Portkey, and Arize provide built-in cost tracking that bridges this gap without building a custom pipeline.
Next Steps: Get Your Real Numbers
Managing AI spend requires outcome-based metrics, not just input metrics. You have three paths forward depending on your current data maturity:
If you have telemetry: Use our Cost per Success Calculator (5 minutes). Input your token volume, success rate, and escalation rate to see your actual unit economics.
Ready to automate? Check PromptMetrics to start analyzing and optimizing your LLM costs.