
Most AI rollouts die in month three. We build the ones that don't.
PromptMetrics helps teams put AI to work under a human gate. Not another tool rollout, but the human skills and the technical infrastructure that make AI work inside your organisation.
First call: you name the broken workflow, we tell you honestly if we're a fit. If we're not, we say so.
You know the moment.
Someone above you said "we need to be doing AI." They handed it to you with no training, no direction, and no one to ask. Just a mandate and a number to hit.
So now you're holding a mandate with no budget clarity, no technical co-pilot, no playbook, and a deadline. You've watched the demos. None of it felt real, or built for how your team works.
That moment is the whole reason we exist, whether you got handed the mandate, you're a founder wearing every hat, or you've already been burned by a tool that died in production.
Two people. One human side, one technical side. Applied the same way at every step.
Ranya is the human skills. Izzy is the technical infrastructure. The same two modes show up at every rung of how we work, from a first Sprint to a full Pilot to the Cohort. Depending on what a workflow needs, we build it for you, build it with you, or help you figure out what to build first. We tell you which one in the first conversation.
We build the implementation
The connections, the skills that replace the manual work, the governance layer with a human review step at every stage. Documented so any developer can maintain it. Nothing is a black box.
We build the first one together
We sit with your team, build the first workflow together, and leave you able to build the next one without us. You keep the capability, not just the tool.
We give you the plan
You have the mandate but no clarity on where to start. We give you a plan you can execute, with what to build, in what order, for which team — not a slide deck you can't action.
Start small. The first yes shouldn't feel like a gamble.
You don't have to bet the budget to find out if this works. Most people start with a Sprint, see the result, and decide what's next from there.
One workflow, turned into one governed skill, in one to two weeks. Fixed scope, fixed price. The smallest real thing we can do that proves the point.
See the SprintA real team, one workflow, four to six weeks, wrapped in the same governance and human-gate discipline as the Sprint. We baseline it before we touch anything, then measure again after, so the number is yours, not ours. You meet the price in conversation.
How the Pilot worksLive, Ranya-led, capped seats. Bring your real work, and we build the thinking skills together, without a full build.
See the cohortThe things we won't compromise on.
Four promises we can keep today.
You stay in charge.
Every workflow has a human review step: the proposed action, the payload, the evidence behind it, and a rollback path, before anything ships. Draft, then you review, never autonomous action. You are the gate. Nothing goes out without you, and there's a record of exactly what you approved.
Nothing is a black box.
The skills we build are markdown files. Any developer you ever hire can read them, change them, and maintain them. You're never locked in to us.
We measure before we touch anything.
Most rollouts skip this and pay for it later. We baseline your workflow, timed, not surveyed, before we build. Any number you hear is a hypothesis we test together in your environment. You own the data.
We stay until it works.
When a tool in your stack changes and a workflow breaks, we fix it. And when your team stops using what we built, we work on that too. The build is the easy part. Adoption is the part we don't leave.
Don't take our word for it. Read the code.
We can't show you a Fortune 500 logo wall, because we don't have one yet. So we show our work instead: a free, working skill you can install and judge for yourself. Giving it away isn't a lost sale, it's the proof. The skill is plain markdown, so any developer can read it, change it, and maintain it. What we sell is the part a markdown file can't do: the connection into your stack, the governance, the change management, and the human layer that makes it stick.
# free, MIT. a skill is a folder of markdown
$ git clone https://github.com/promptmetrics/skills.git
$ cp -r skills/qbr-prep ~/.claude/skills/
✓ read it, edit it, own it
# point it at your own work and judge it
Based in Berlin. We don't pretend the EU questions away.
EU data residency, the DPA, no training on your data: real procurement questions, available at the platform's enterprise tier. We'll tell you exactly where the gaps are rather than wave them away.
From August 2, 2026, the EU AI Act applies to how you use AI, not just who builds it. You owe two things now: a team trained to use AI properly, and a clear label on AI-made content that could pass as real. More rules land in 2027. The governed layer we build is how you get ready once, not twice.
How it works, and what leaves the buildingNo case studies yet. Our first customers are writing them with us right now. Go first and you get our full attention, a price that reflects it, and five businesses and 13 years of building behind you. If you need someone else to have gone first, we're not the right fit yet, and we'll say so.
What we’re writing about.
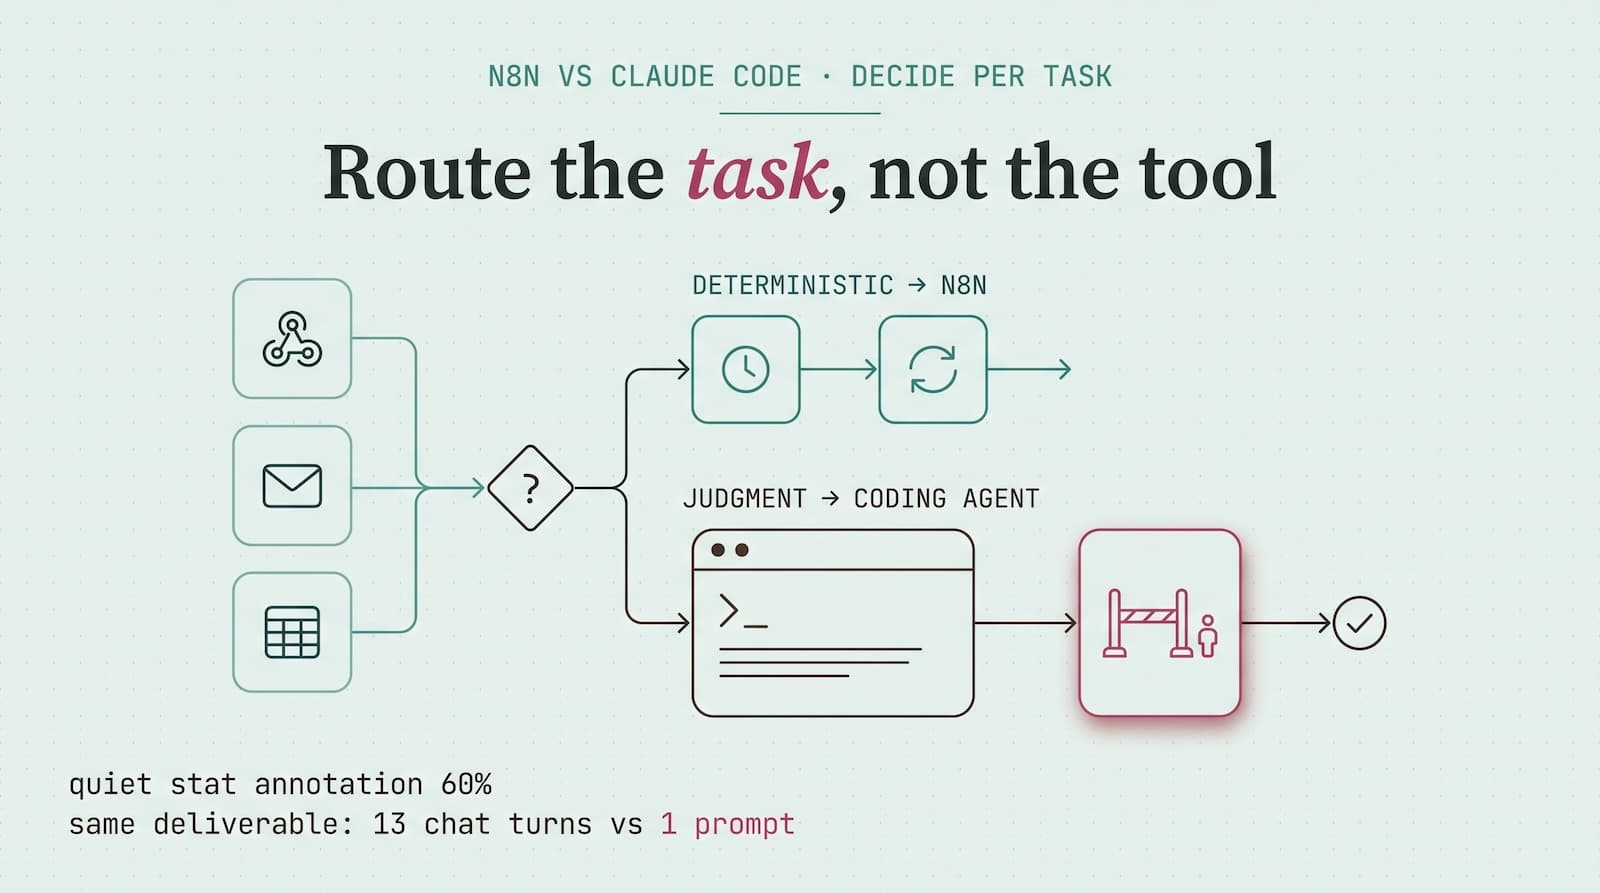
n8n vs Claude Code: Which Tasks Go Where?
More than 80% of n8n workflows now involve AI agents. Operators still pick tools before tasks. A per-task framework for n8n vs Claude Code, with cost math.
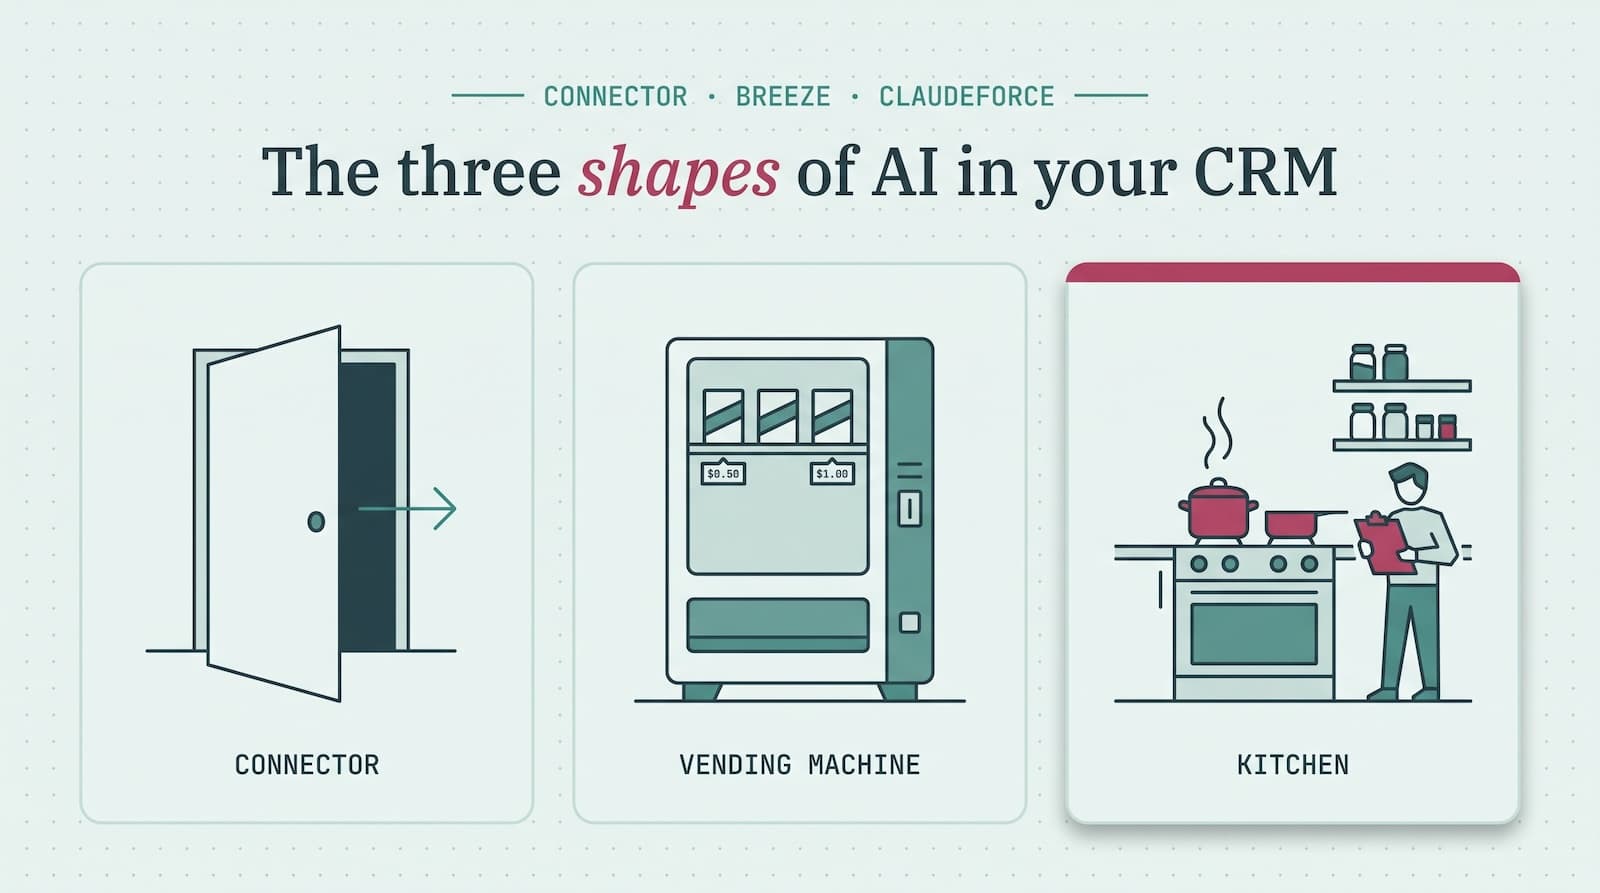
Claudeforce vs. MCP vs. Breeze: What Changes for RevOps?
Claudeforce puts Claude inside Salesforce's trust boundary; Breeze bills $0.50 per resolved ticket. What each means for cost, guardrails, and EU compliance.
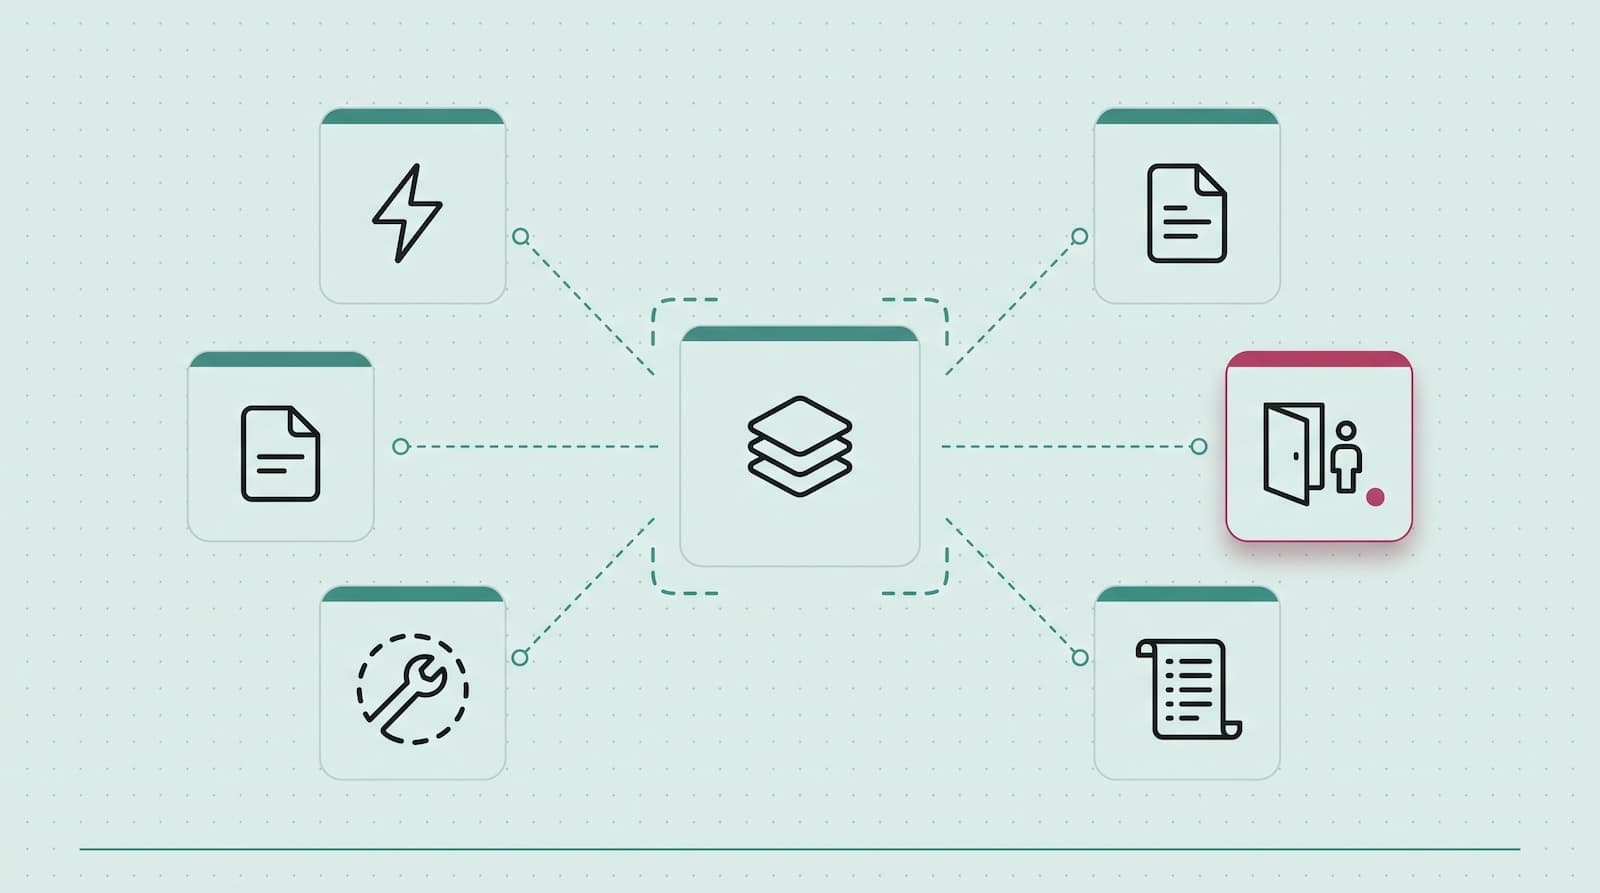
AI Workflow Automation: One Governed Skill, Torn Down
At least 50% of GenAI projects die after the PoC (Gartner, 2026). Here is one governed skill torn down: the file, the human gate, the baseline, the after.
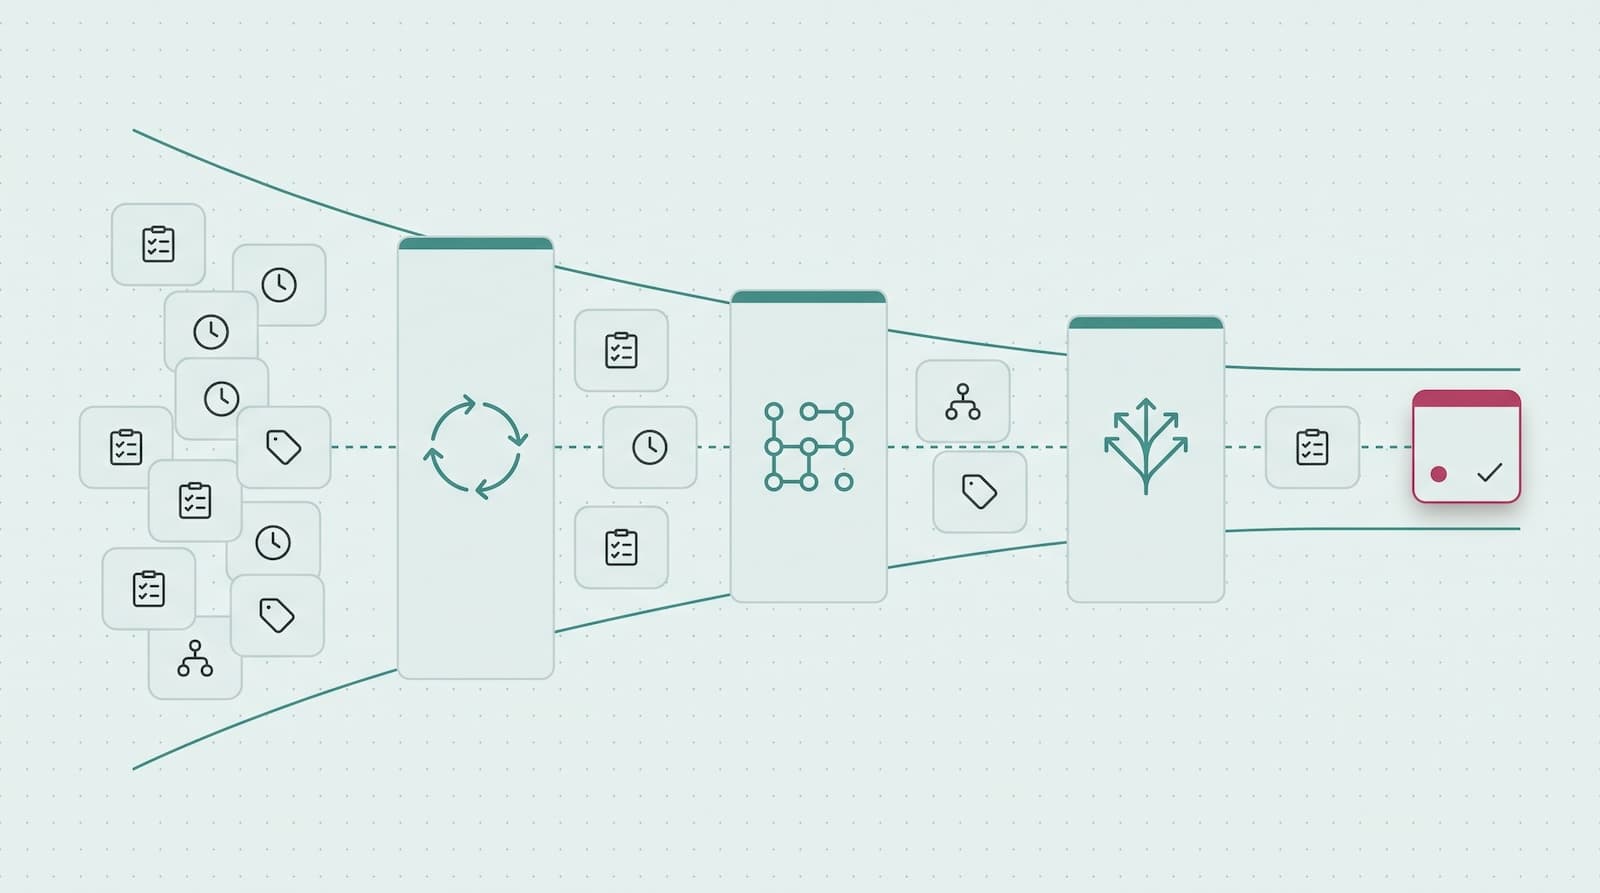
What to Automate First with AI: The Toil Test
Gartner predicts over 40% of agentic AI projects will be canceled by 2027. The toil test: three filters for picking a first AI agent workflow that survives.
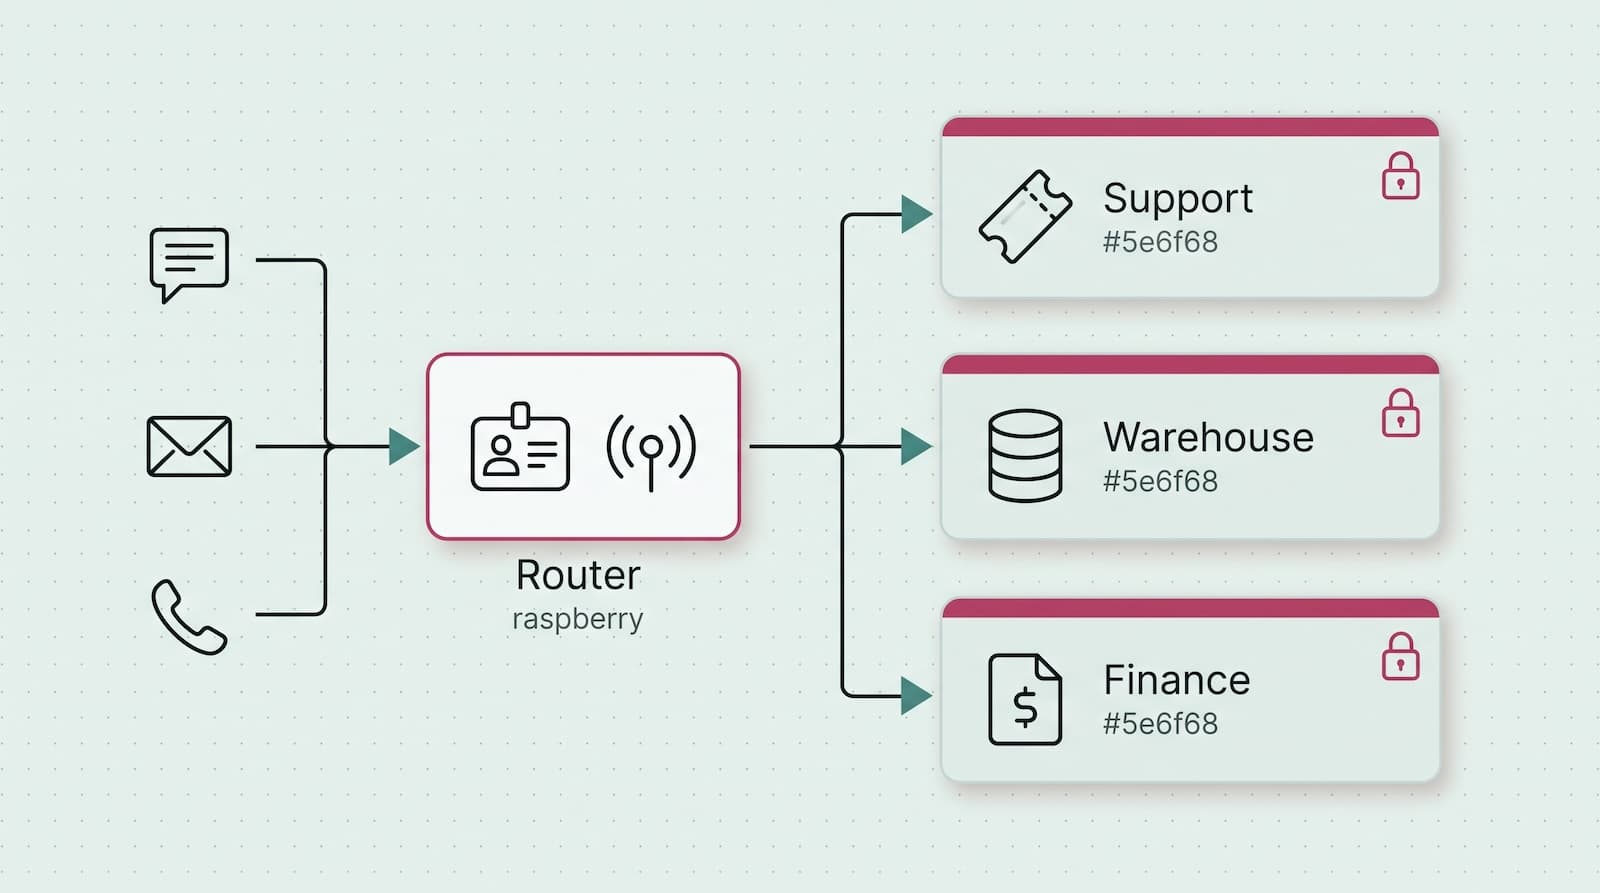
One AI Agent vs Multiple Agents: Wrong Question
One agent or many is really a permissions question. 45.6% of teams still share API keys between agents. Design who sees what before you pick an architecture.
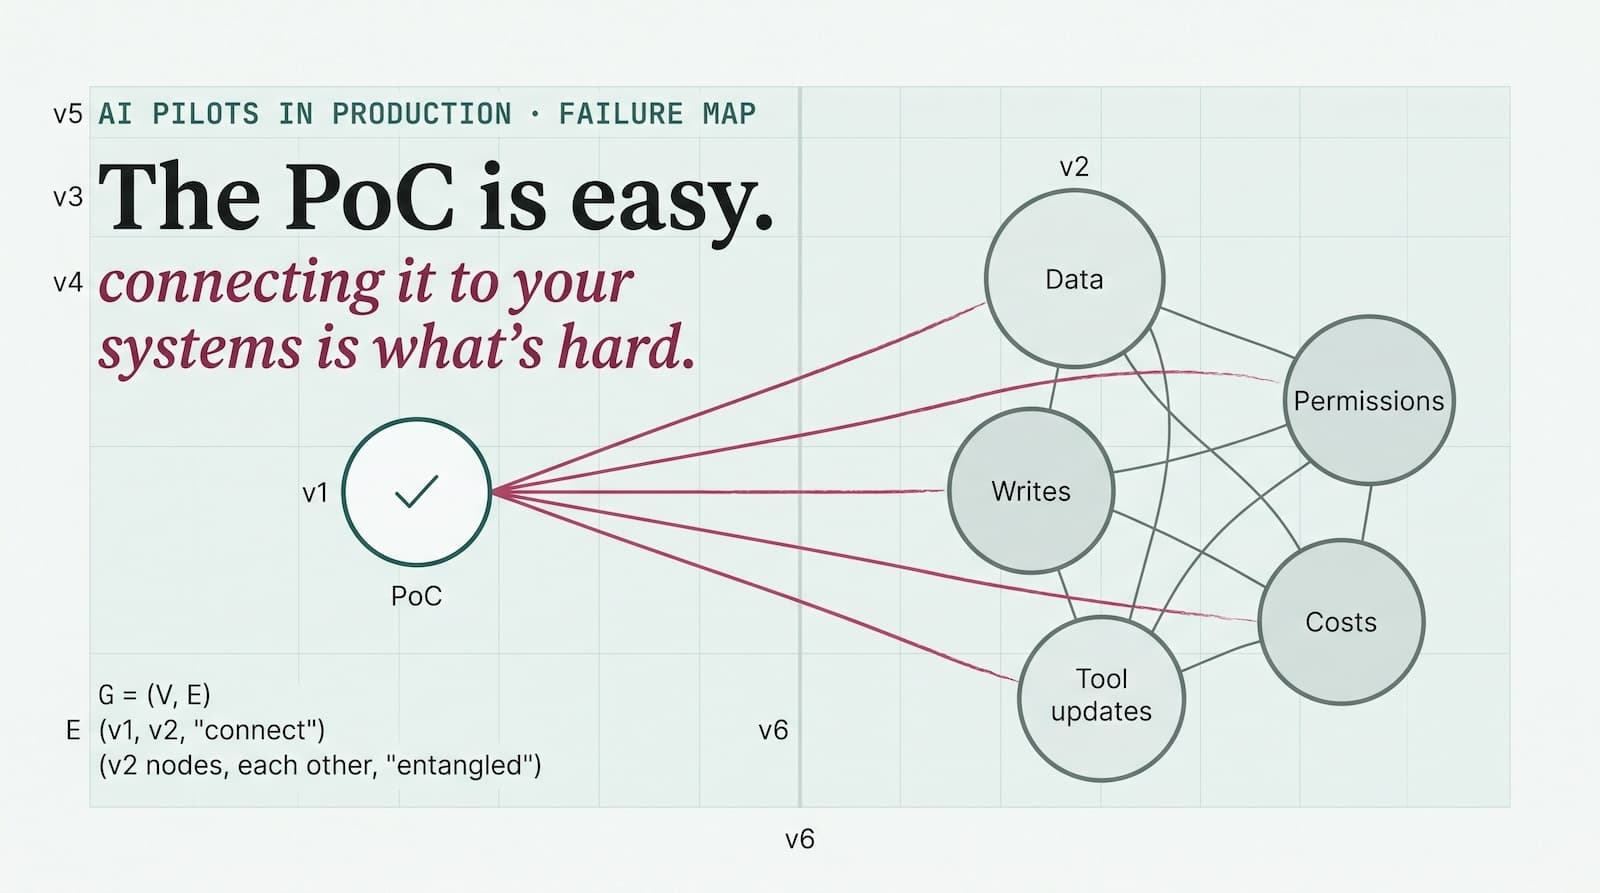
The Demo Worked. Here's Why AI Pilots Fail in Production
Gartner: at least 50% of GenAI projects died after proof of concept. Vercel's CEO named the wall: connecting agents to your systems. Here's the failure map.
Tell us the thing that's broken.
Not the general AI opportunity. The specific workflow that costs you the most time or money right now. If you can name it in a sentence, we can have a real conversation about it. The first call is free, and it's a conversation, not a pitch.