
You rolled out a coding agent or two. Tickets close faster. The team seems less swamped. Then someone asks the question a good feeling can't answer: what's this actually worth? If you want to prove AI ROI rather than assert it, you need a number, and you probably don't have one.
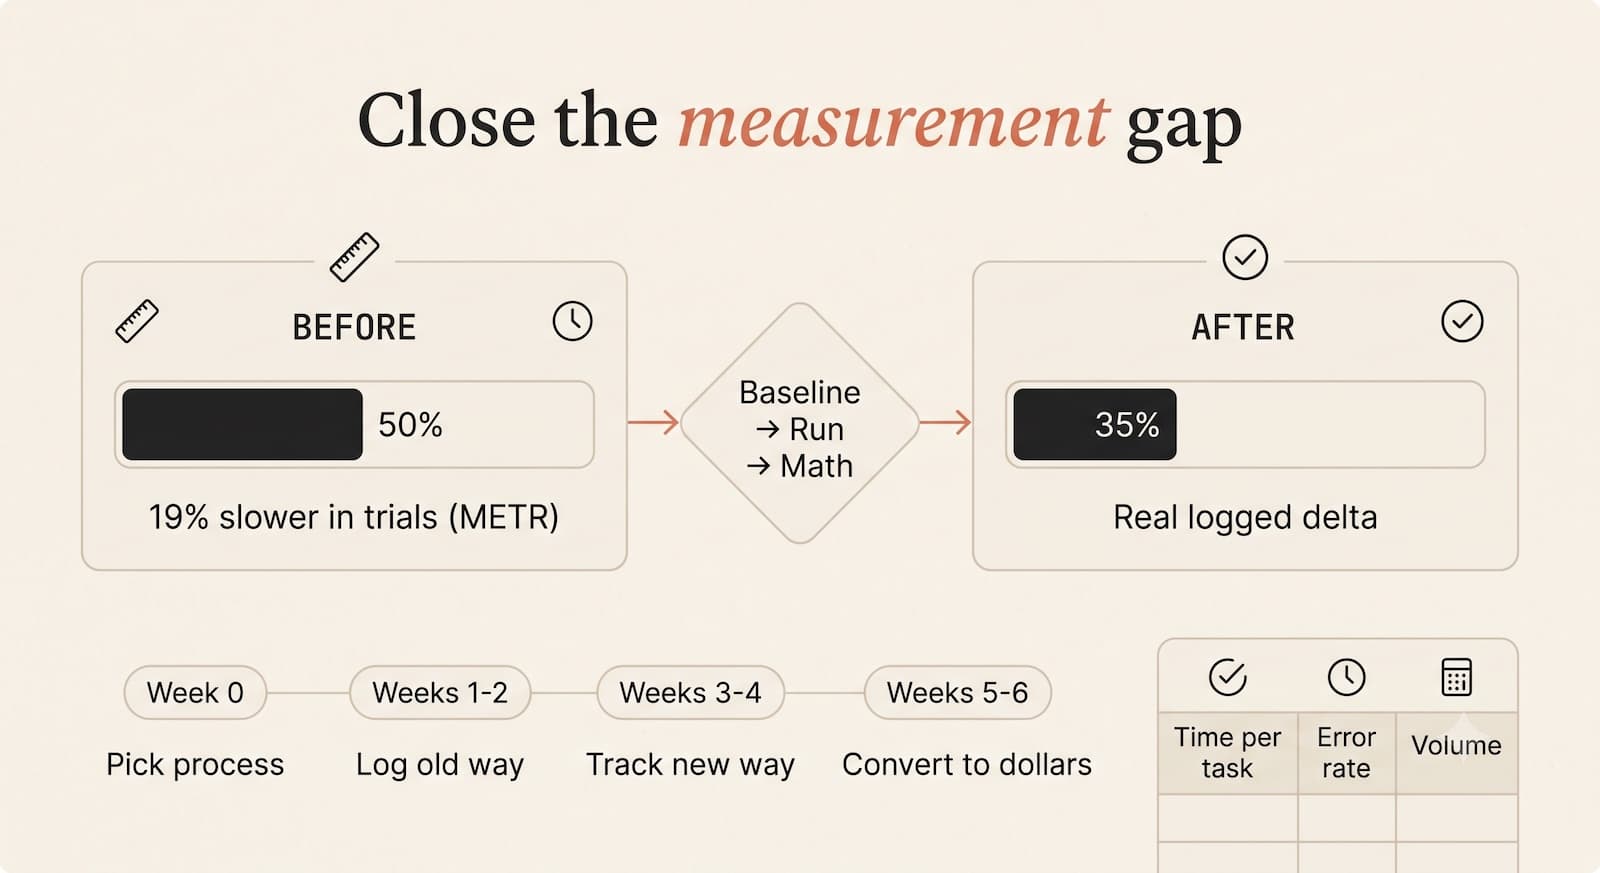
Here's why that's harder than it sounds. In a randomized trial, experienced developers took 19% longer to finish tasks when allowed to use AI tools. Afterwards, those same developers estimated AI had made them 20% faster (METR, July 2025, 16 developers across 246 real tasks). They weren't lying. They measured wrong, because they didn't measure at all.
That gap between felt improvement and recorded improvement is the whole problem. This is a six-week plan that closes it. One process, three metrics, one spreadsheet.
Key Takeaways
91% of SMB leaders using AI say it boosts revenue (Salesforce, 2024), but saying it and proving it are different problems.
Pick one process. Not the rollout.
Track three metrics: time per task, error rate, volume handled.
Baseline the old way for two weeks before you change anything.
A small credible number beats a big unverifiable one.
Why Can't Most Teams Prove the AI ROI They're Sure Exists?
Because the process was never measured before it changed. Without a recorded baseline, every improvement is an estimate wearing the costume of evidence. And self-estimates are worse than most people expect: METR's developers were off by roughly 39 percentage points in the wrong direction, and METR's own conclusion was blunt: that anecdotal reports of speedup can be very inaccurate (METR, 2025).

The trap is structural, not lazy. You deployed the agent because something was broken and the team was drowning. So you moved fast, it worked, and the urgency evaporated. Four months later, finance wants attribution,n and nobody kept a record of how long the old way took.
That leaves two bad options. Say "trust me, it's working," which no finance team accepts. Or spin up a three-month measurement project, which makes the whole thing feel academic. Neither is necessary.
The gap scales all the way up, too. Among large-enterprise CEOs, 56% say AI has delivered no significant financial benefit and only 12% report gains in both cost and revenue (PwC's 29th Global CEO Survey, January 2026, 4,454 CEOs across 95 countries). Bigger budgets don't fix it. Measurement discipline does.
<!-- TODO [PERSONAL EXPERIENCE]: Izzy, drop in a specific PromptMetrics engagement here. What did the client actually argue about when the baseline was missing? Who asked for the number, and what happened when nobody had it? 2-4 sentences, concrete. -->
This is the same trap covered in Why AI Rollouts Stall by Month Three.
The Six-Week Plan at a Glance
Six weeks is the right window. Long enough to smooth out weekly noise, short enough that the project still feels urgent to everyone involved.
Week 0: Pick the process. One high-volume, repetitive workflow with a single owner. Choose your three metrics.
Weeks 1 and 2: Baseline the old way. Log every run in a shared spreadsheet. Change nothing.
Weeks 3 and 4: Turn it on and track the delta. Same metrics, same logging, same team. Change nothing else.
Weeks 5 and 6: Convert minutes into dollars. Apply the savings formula, calculate payback period, write down your assumptions.
That's it. No BI tool, no dashboard software, no data scientist.
How Do You Pick the Right Process to Measure (Week 0)?
A measurable pilot process meets three tests: it runs at least 20 times a week, it follows identical steps each run, and one person can explain it without getting defensive. Miss any of the three and your numbers will be as inconsistent as the process itself.
So think about one intake flow. One approval chain. One report your team still builds by hand. Not "customer service." Not "sales." One workflow you could describe in five sentences to someone who doesn't work there.
The Only Three Metrics That Matter
Pick exactly three. No NPS. No CSAT. No vanity numbers.
Metric | What you're recording | Why it earns its place |
|---|---|---|
Time per task | How long one complete run takes, start to finish | Converts directly into money later |
Error rate | How often someone catches a mistake or redoes the work | Stops a clean-looking number from being a lie |
Volume handled | How many runs the team completes per week | Turns a per-task saving into a weekly one |
Why so few? Because the moment you start tracking logins or prompt counts instead of outcomes, you lose the thread that proves value. That failure mode gets its own post: The AI Mandate Paradox.
<!-- TODO INTERNAL LINK: one more contextual link belongs here, pointing at whichever Cluster B post covers scoping the first automation. Suggested anchor: "picking which workflow to automate first". I don't know the slug, so leaving it to you. -->
How Do You Baseline the Old Way (Weeks 1-2)?
Baselining means logging the existing process for two full weeks before you change anything. One spreadsheet row per run, three columns, filled in at end of day. Five minutes daily, maximum. That's the entire tooling requirement, and it's deliberately boring.
Resist the urge to instrument this properly. Why keep it crude? Because every hour spent building a tracking system is an hour the baseline isn't running, and a half-finished dashboard produces worse data than a spreadsheet somebody actually fills in. The baseline will be messy either way. You're not chasing precision, you're building a number that's directionally true and survives a skeptical read.
One thing to decide now rather than later: what counts as a completed run. Does a task that gets escalated count? What about one that gets abandoned? Write the definition at the top of the sheet in week one, because if you settle it in week five you'll settle it in whatever way makes the number look better.
What If the Agent Is Already Live?
Reconstruct the "before" from history. Ticket timestamps, old email threads, and system logs still show how long the process used to take and how often it broke. Pull the two weeks immediately before go-live, so seasonality doesn't distort the comparison.
Imperfect beats absent, and finance cares more about honesty than decimal places. But say plainly that the baseline is reconstructed, and name the records you pulled it from. A reconstructed baseline you've labelled as such is credible. The same baseline presented as a clean measurement falls apart the first time someone asks how you captured it.
How Do You Track the New Process Without Breaking the Comparison (Weeks 3-4)?
Turn on the new process and track the same three metrics, logged by the same people at the same time of day. Two rules protect the comparison: change nothing else, and log every failure.
Swap a tool mid-test, add a second automation, adjust volume targets, and you've destroyed attribution. You'll have a better number and no way to explain where it came from.
The second rule matters more than it looks, and the research shows why. When METR ran a follow-up study in late 2025, between 30% and 50% of participating developers admitted they were quietly declining to submit certain tasks because they didn't want to do those tasks without AI (METR, February 2026, 57 developers across 143 repositories). Nobody instructed them to cherry-pick. It happened anyway, inside a controlled trial run by professional researchers who were watching for exactly that. What are the odds your team is more disciplined than that?
Assume it'll happen and make it hard to. Log every redo, every exception, every time the agent handed back something wrong. Those entries are what make the final number survive scrutiny, and their absence is the first thing a skeptical reader notices.
<!-- TODO [UNIQUE INSIGHT]: Izzy, this is where a contrarian observation from PromptMetrics work would land hardest. Something like: what do teams consistently get wrong in weeks 3-4 that you've now seen enough times to predict? Back it with what you saw, not a generality. -->
How Do You Turn Minutes Saved Into a Dollar Figure (Weeks 5-6)?
One formula does the work:
(Old time per task − New time per task) × Weekly volume × Fully loaded hourly cost = Weekly savingsFully loaded hourly cost is salary plus benefits plus overhead, divided by roughly 2,000 working hours a year. Finance already has this number, so ask for it rather than inventing one. A made-up rate is the fastest way to lose the room.
Then multiply weekly savings by 52 for the annual figure, and calculate payback period as total project cost divided by weekly savings. A $12,000 project saving $1,500 a week pays back in eight weeks. That's usually the only number your CFO repeats to anyone else.
Worked Example: Acme SaaS (Illustrative Only)
These figures are a placeholder company and illustrative math, not a client outcome. Acme SaaS times its contract-intake process before and after deploying an agent.
Input | Before | After |
|---|---|---|
Time per task | 45 minutes | 20 minutes |
Weekly volume | 60 tasks | 60 tasks |
Fully loaded hourly rate | $40 | $40 |
Weekly hours on the process | 45 hours | 20 hours |

The math runs in four steps. Twenty-five minutes saved across 60 tasks is 25 hours a week. Twenty-five hours at $40 is $1,000 in weekly savings. Annualized, $52,000. So if setup cost $10,000, payback lands at 10 weeks, ks and net first-year savings sit near $42,000.
Write those four steps down. Because when someone re-runs your math with a $32 hourly rate instead of $40, you want them adjusting one input rather than rebuilding your reasoning from scratch.
What Separates Real Proof From a Number Nobody Trusts?
Defensible proof has three components: a before-and-after on one process measured both times identically, error and failure cases documented rather than omitted, and assumptions written down so the math can be re-run with different inputs. Walk in with those three and a modest number, and you win the room.
Notice what's absent from that list. Size. A $1,000-a-week saving on one workflow, documented properly, travels further inside a company than a $400,000 annual figure built on estimates, because the first one can be checked and the second one can only be believed. Once a number gets questioned and holds, it becomes the reference point for the next three projects.
What if the numbers are bad? Then you've learned something in six weeks instead of eighteen months. Only about one in four enterprise CEOs say their organisation has disciplined processes for stopping underperforming initiatives (PwC, 2026). Companies with entire strategy functions struggle to kill things. A ten-person ops team with a spreadsheet has no such excuse, which is the advantage nobody mentions.
So if the tracked metrics show no clear improvement by the end of week four, treat that as the answer. A killed pilot with clean documentation reads as more credible than a rollout that underperforms in silence for a year. Forcing a good story out of flat data only costs you the next budget conversation.
FAQ: Proving AI ROI Without a Data Team
Do I Need a Data Team to Prove AI ROI?
No. A shared spreadsheet with three columns, logged once a day for six weeks on a single process, produces a defensible number. Dashboards become useful later, once you're tracking five or ten processes simultaneously and manual logging stops scaling.
What's a Realistic Time Savings for a First AI Project?
Smaller than the marketing suggests. Across nationally representative US survey data, workers using generative AI reported time savings equivalent to just 1.4% of total work hours, with between 1% and 5% of all work hours AI-assisted (Bick, Blandin and Deming, NBER Working Paper 32966, September 2024, revised February 2025). Workflow-level savings on a well-chosen repetitive process run far higher than that economy-wide average, which is exactly why you measure your own process instead of borrowing a headline percentage.
What If the Agent Is Already Live and I Never Baselined It?
Reconstruct the "before" from ticket timestamps, email history, and system logs, pulling the two weeks immediately before go-live. It won't be exact. It will be enough to build a comparison people believe, provided you say plainly that it's reconstructed and show which records you used.
How Do I Know When to Kill the Project Instead of Pushing Forward?
Set the kill criteria in week 0, before you're emotionally invested, then hold to them. If the metrics show no clear improvement by the end of week four, stop. Only one in four enterprise CEOs report having disciplined processes for exactly this decision (PwC, 2026), so you're not behind anyone by writing yours down early.
What If My Error Rate Goes Up During the Test?
Track it and report it. Documented failures are what make a time-savings figure believable, and a suspiciously clean win invites the scrutiny you were trying to avoid. Rising errors also tell you something useful: the agent may be shifting work into review rather than removing it.
How Widespread Is This Problem, Really?
Widespread enough that adoption has outpaced measurement everywhere. As of late 2024, 23% of employed US adults had used generative AI for work in the previous week, and 9% used it every working day (Bick, Blandin and Deming, NBER, 2024). Adoption at work moved as fast as the personal computer did. Measurement practice did not keep up, which is why so few teams can answer the ROI question.
Start With One Process, Not the Whole Rollout
Six weeks, one process, three metrics, one spreadsheet. Pick the process in week 0. Log the old way for two weeks. Run the new way for two weeks without touching anything else. Then do the math in weeks five and six, and write down what you assumed.
Once you can point at a real dollar figure on one workflow, you stop needing to defend the rollout with login counts. That's the whole reason this beats a usage dashboard: a small believable number ends the argument, while a large unverifiable one restarts it every quarter.
And remember what METR's developers demonstrated. Being certain a tool is helping is not evidence that it is. Write the number down.